01
Temperature curve
The Pi starts near 56.8°C, rises above the 80°C region during sustained CPU load, and reaches 85.1°C before cooling quickly after the load stops.
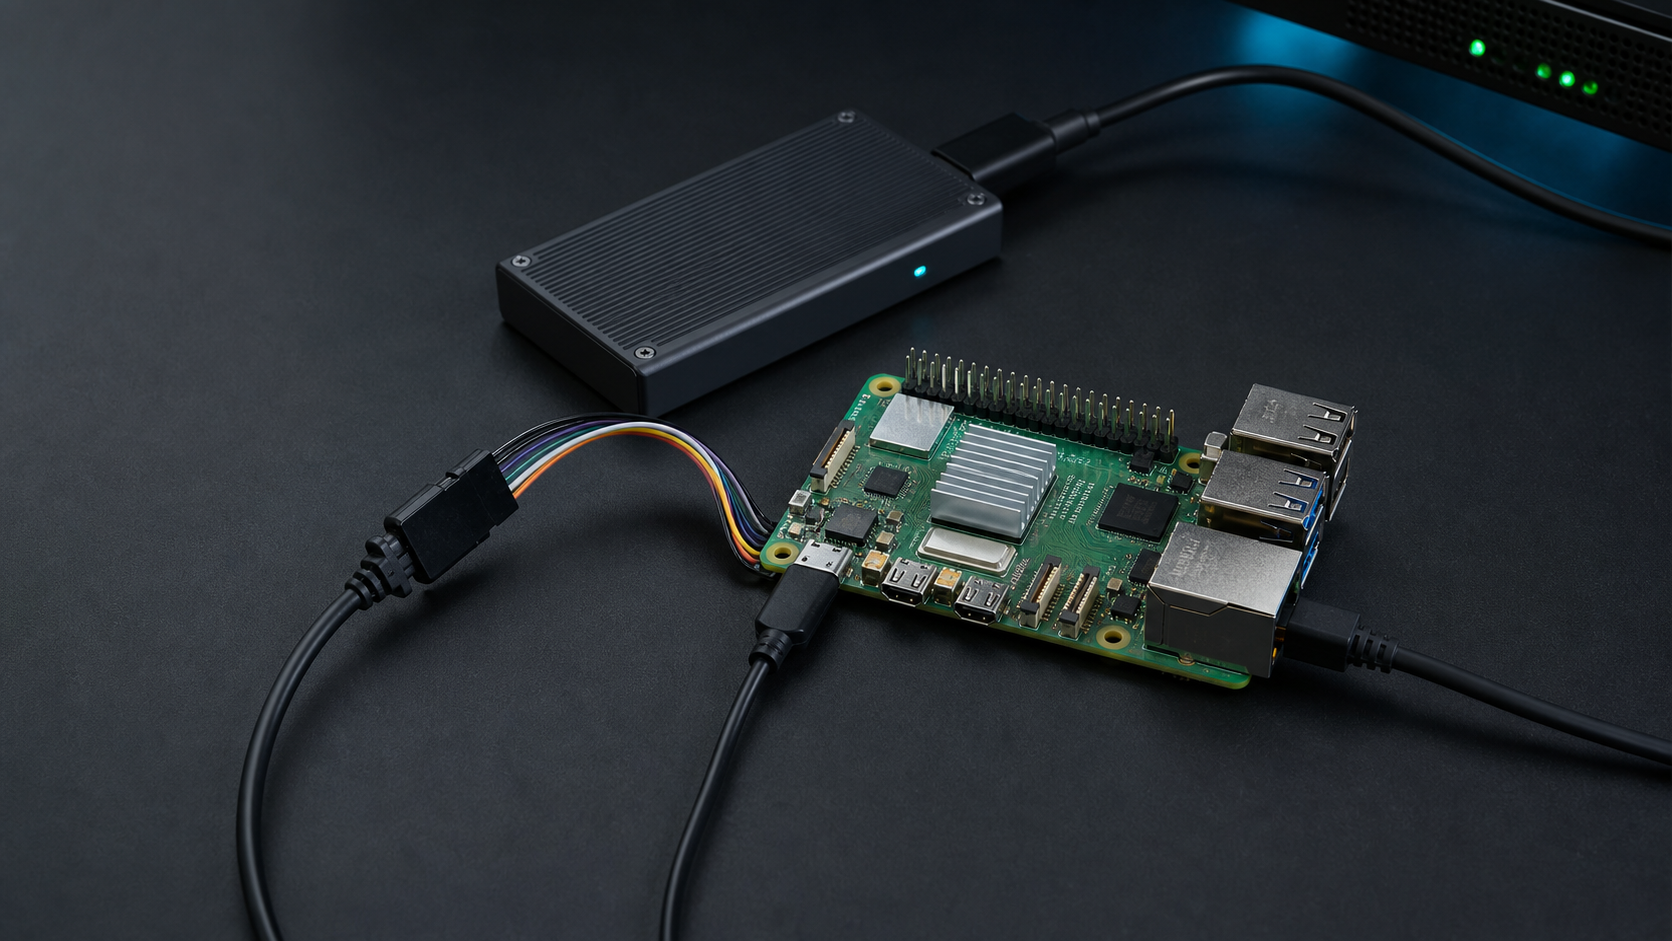
An interactive Plotly dashboard showing temperature, firmware throttling flags, and cooldown behavior from a 10-minute four-core Raspberry Pi 5 load test.
Temperature and firmware flag observations.
Four-core CPU load followed by cooldown.
Recorded before the load phase.
Observed near the end of the stress interval.
Thermal behavior, not a recorded power-supply event.
What it shows
The dashboard combines a temperature timeline with Raspberry Pi firmware throttling bitmasks. This makes the result more useful than a single peak temperature: it shows when the board crossed alert thresholds, when history bits latched, and when current throttling was actually captured.
The Pi starts near 56.8°C, rises above the 80°C region during sustained CPU load, and reaches 85.1°C before cooling quickly after the load stops.
The plotted get_throttled states show soft-temperature, frequency-capping, and throttling history instead of treating the run as just a raw sensor trace.
No current or historical undervoltage bits were observed, so the recorded protection behavior is thermal in this run.
Interactive view
Hover or tap inside the chart for exact values. The embedded dashboard keeps its own controls, zoom behavior, range slider, data tables, and export button.
Interpretation
During the stress interval, the Pi enters the high-temperature region and records firmware protection history. Current Arm-frequency capping and current throttling were captured for 11 seconds. After the load ends, current flags clear while historical flags remain latched, which is expected for this class of firmware reporting.
The board handled the run, but sustained CPU work reached a firmware-controlled thermal plateau. For long-running Raspberry Pi workloads, this is the point where cooling, enclosure airflow, and workload scheduling become operational concerns.
Related work